This was my first introduction to data analysis, conducted for my research course at uni. I used pandas, seaborn, numpy, and matplotlib to investigate the correlation between a video game’s price and its playtime. I was tasked with coming up with a topic to research, finding usable data to investigate the question, creating a presentation to explain the topic and recieve feedback, and creating a final presentation & report to present my findings. My hypothesis stated that the higher the price of a video game, the less time on average would be spent playing the game.
To choose my topic, I came up with different ideas of mine and looked for relevant datasets. I also made sure the topic was simple enough that I could complete it with no background experience in data analysis. The biggest issue I faced was getting the datasets to work together properly, as they were formatted quite differently and I had to match up the relevant info (playercount & price) across datasets. Once the datasets were properly integrated, I created visualisations displaying the correlation in different relevant formats.
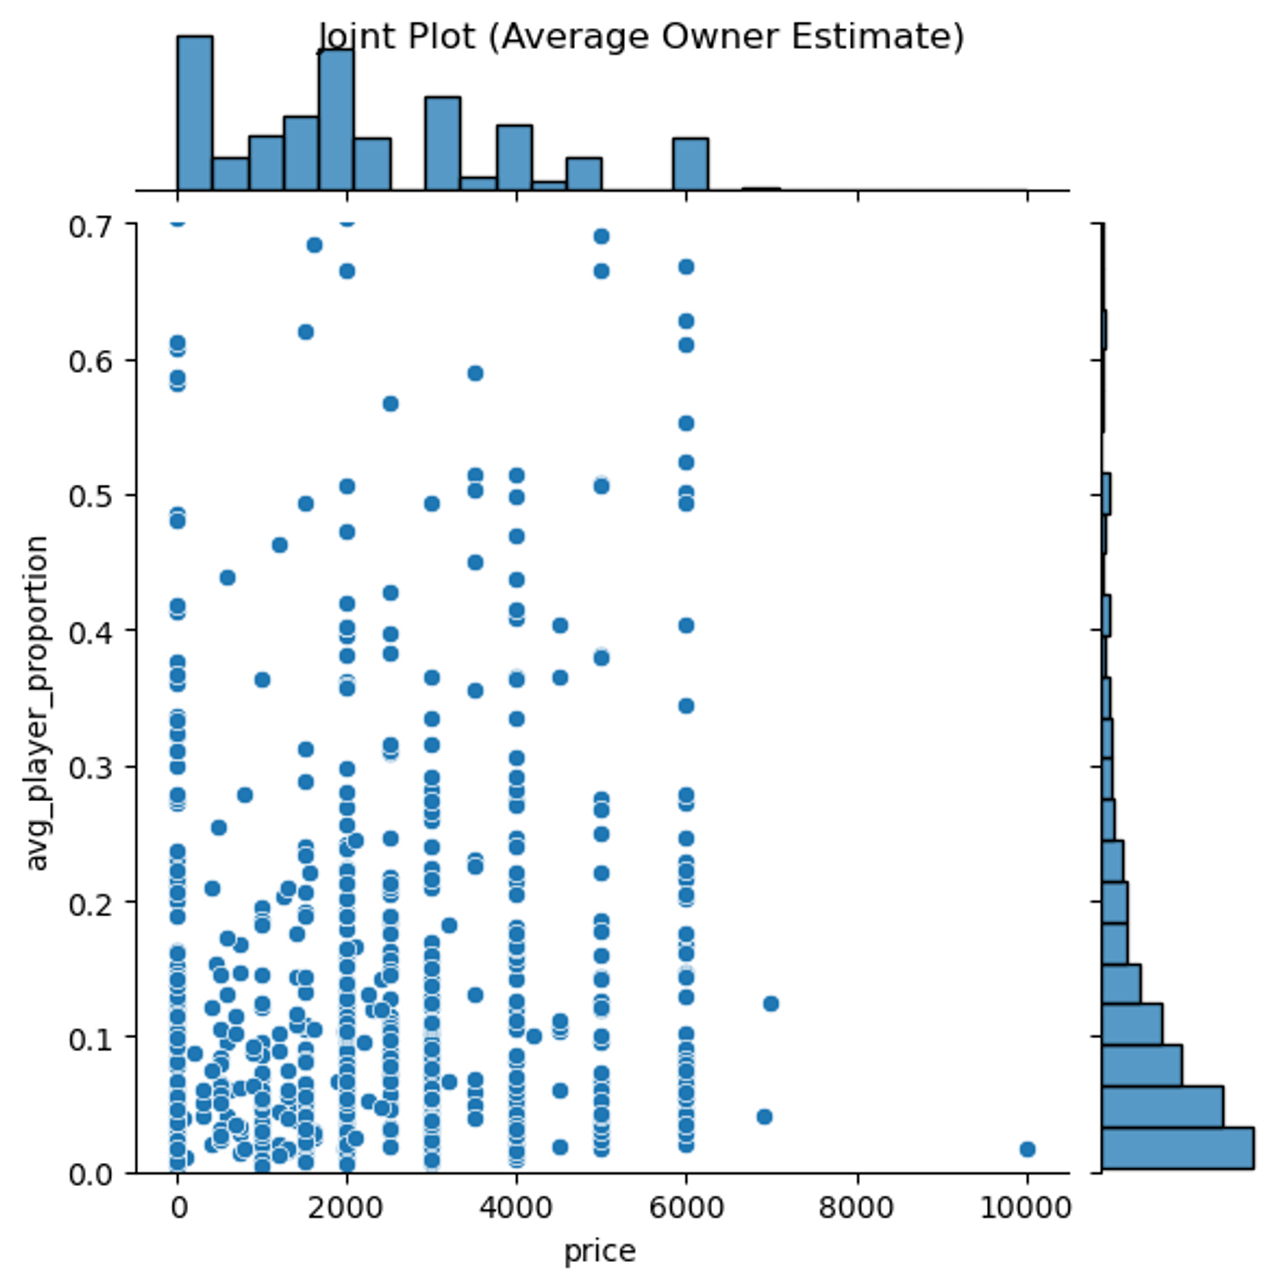
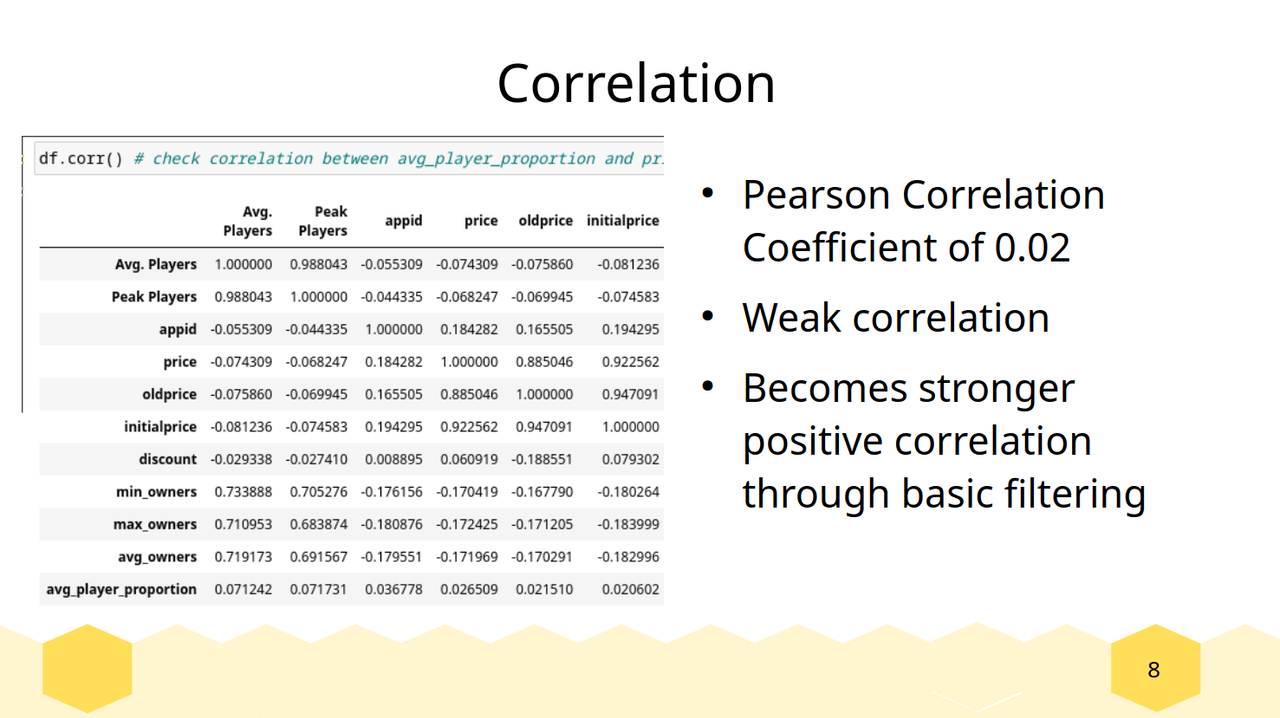
No correlation was found, and I was unable to disprove my null hypothesis. This is in part due to an incomplete dataset. Although I was careful to make sure I had a large sample size and relevant information, I hadn’t yet figured out the calculations that would need to be conducted to find the correlation. My datasets contained average player count at any given time, and the price of each game. I also needed to know the total sales number of that game on steam, which in the end I was unable to find, and it was too late to switch topics. Another gap in knowledge was the price dataset only reflecting one point in time, which limited the amount of player count data I could use. The correlation that did appear was positive, and I estimated that having a complete dataset would also be unable to disprove my null hypothesis. In my final report, I discussed these issues, and what would be needed for effective further study.
Check it out on GitHub to see how the data was analysed.
This was the first project I conducted for my Grand Challenges in Computer Science course in 2022. See the second project here.